Take this quick poll: You will vote for whom on Nov. 6? Post Choice Here. (Results began Tu.9Oct12) + Quiz: Find Candidate With Your Values (Summary) & WP's alternate quiz, at the page's bottom & Issues: Romney versus Obama + View/Print A Chart of the 5 Principal Candidates' PositionsList of All 14 Presidential Candidates | Vote in 14 President Candidates Preferential (mock) PollSee Current ResultsVoter Demographics (Mo.22Oct12, IBD)"Believe It Or Not: Biden Romney's VP? plus A Strange Possibilty!"Politifact's "Truth-O-Meter & Flip-O-Meter" • Presidential Election Fact Checks: Campaign ClaimsPants on FireObamameter & RomneyQuiz: Are you a Conservative or a Liberal? Discover your political party alignment. & If you are very conservative, maybe you are a PaleoConservative too.
ElectionProjection dot com election results

Polling DataElection Background DataElection Graphs, Charts & Data TablesIssuesTake ActionVoter Guides/RecommendationsRegister to Vote/Check StatusFind/Contact Officials & CompatriotsAmerican Heritage/Documents
Countdown: (local) - Election Calendar/Events Schedule: RCP & PBS (270 to Win)
"Although a measure may have passed originally by a large majority vote in both houses, a two-thirds majority of those present in each chamber is required to override the President’s veto."
(source: http://www.au.af.mil/au/awc/awcgate/crs/98-157.pdf)
ProLife (51%) v ProDeath (41%) death (Gallup) • 2nd Amendment +97% (USA Today)
(U6) Underemployed=14.6%-22.5% (U3) Unemployed=7.9%-14.6% (29.9% ELC,CA 21Sep12) (WND & BLS/U.S. Gov & Gallup & Ca.gov EDD)

Unemployment: U1=4.4% • U2=4.2% • U3=7.9% • U4=8.4% • U5=9.3% • U6=14.6% (2Nov, http://www.bls.gov/news.release/empsit.t15.htm)
OHIO: Leans Obama Toss-ups: CO, IA, NH, VA, WI plus FL-Leans R • NV, OH-Leans O (Sabato, Mo.5Nov12)
OHIO: Obama 49.4% • Romney 46.5% (Mo.5Nov, Rasmussen)
OHIO: O-49.4 • R=46.5 (RCP, Su.4Nov12)
OHIO: O-48% • R-46 (We.31Oct12, Cleveland Plains Dealer)
Stephen Koff By Stephen Koff, Cleveland Plain Dealer Washington Bureau Chief by Stephen Koff, Cleveland The Plain Dealer, Washington Bureau Chief, October 28, 2012 quote article source: http://www.cleveland.com/open/index.ssf/2012/10/ohio_presidential_poll.html
  "..Ohio is widely acknowledged as the ultimate prize. ¶ Political scientists and analysts say it would be very hard to win 270 electoral votes, a bare majority, without Ohio and its 18 electoral votes that go to the victor.  Since 1860, when Abraham Lincoln won, every Republican who won the presidency has done so with the help of Ohio.  And John F. Kennedy was the last Democrat who won the presidency without taking Ohio.  That was in 1960."
RCP Electoral: Obama - 201 Romney - 191 (Toss Ups: 146)
       • 270 Votes Are Needed To Win on Mo.17Dec12 in the Electoral College.
also see: Obama (D) vs. Romney (R) (RCP Polls: 1 Page Print)
Obama (D) 48.8% Romney (R) 48.1% (RCP Polls)
Obama's Job Approval / Disapproval Polling Data
from Real Clear Politics Latest: -47.4% v +50.0%

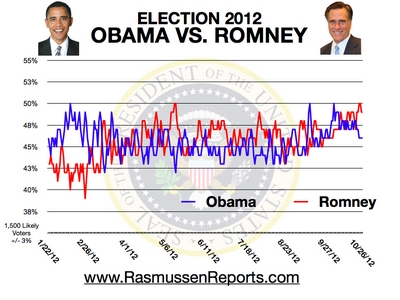
Rasmussen: Obama = 48% • Romney = 49%
Rasmussen: Tu.6Nov12
Presidential Approval Index -8
Strongly Approve 35%
Strongly Disapprove 43%
Total Approve 50%
Total Disapprove 49%
Rasmussen Reports' Daily Presidential Tracking Poll
Rasmussen Favorables: Congress Members, Presidents & Major Figures
Rasmussen Electoral: Romney - 206 • Obama - 237 • Toss-up 95

Gallup President: 52% Disapprove - 44% Approve (1-4Nov12)
Gallup Election: Obama 49% - Romney 48% (7 day registered avg)
Gallup Election: Obama 46% - Romney 49% (7 day likely avg)

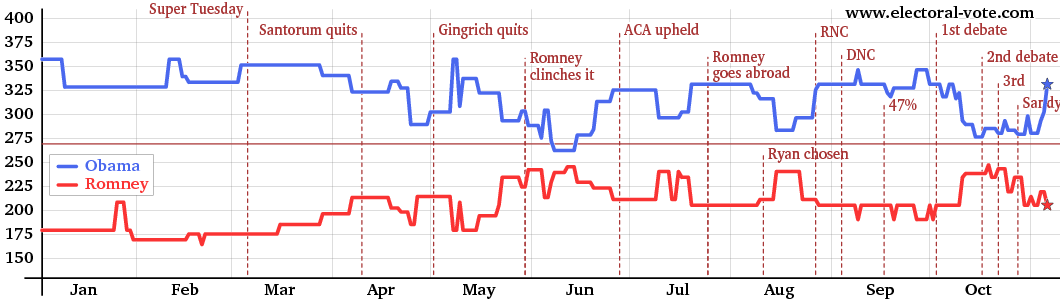
Electoral-Vote.com: O-303 • R-220 + 15 Ties (Tu.6Nov12)
IBD: Romney 48.7% • Obama 50.3% (O+1.6%) (Mo.5Nov, final)
Intrade Election Odds: Obama - 73.4% Romney - 26.7%
Election Projection, Senate: Dem - 51 • Rep - 47 • Ind - 2 (Tu.6Nov12)
Election Projection, House:  Dem - 195 • Rep - 240 (Tu.6Nov12)
Electoral Chart: Obama-303 (49.5%) Romney-235 (49.0%) (O+0.5%) 6Nov12
Reuters/ISPOS: Obama - 48.8% Romney - 48.1% (Mo.5Nov: R46-191E/O48-290E)
Pollster Graph:   Obama - 48.1% Romney - 46.7% (588 polls avg, Huff., 11:50amE)
Pollster Electoral: Obama 277 - Romney 191 (Tu.6Nov12, Huff, 9:51amE)
Washington Post Electoral: 0-243 • R-206 & 0-50% R-47% (Tu.6Nov12)
WSJ Politico/GWU/Battleground: Obama-47% Romney-47% (graphs, Tu.6Nov)
Prognostications
Sabato-State of the Electoral: Obama: 290-Romney: 248 (Mo.5Nov12)
Deserves Reelection?: Obama +40%-54% | Obama 43% Romney 46% (2Sep12)
UCB Predicts: Romney 330/61.3%/Obama 208/38.7% (4Oct12, models)
"USA Today's" Interactive Presidents Comparison Chart (1945-Now)
• RCP's Direction of U.S. Polling Data+GraphLatest Polls + Graphed
• Google's Election Trends: News, Searches, Videos
• Patchwork Nation: State, County, and District Maps & Trending (interactive)
Interactive Graphics - History Timeline: 1832-2012 Dem or Rep Campaigns

"The fate of the country does not depend on how you vote at the polls -- the worst man is as strong as the best at that game; it does not depend on what kind of paper you drop into the ballot-box once a year, but on what kind of man you drop from your chamber into the street every morning." -- Henry David Thoreau (1817-1862)
source: Harrold's Quotes Page

General Election Votes: Graph Source, Huffington Post:
http://elections.huffingtonpost.com/pollster/2012-general-election-romney-vs-obama & Huffington Polls Charts
Electoral College:

Click for www.electoral-vote.com
Election Projection: Tu.6Nov12
Election Projection dot com
source:
http://www.electionprojection.com/2012elections

See All President Obama Job Approval Polling Data
RCP Polls Average
President Obama Job Approval
Black=Positive Red=Negative
source: http://www.electoral-vote.com/evp2012/Pres/ec_graph-2012.html
Table sources: U.S. Economic Indicators & Sabato's "The Echoes of Incumbents Past"
Center for Politics dot org's history of presidential economic indicators
Rasmussen Graph of 2012 Presidential Election
source: Rasmussen Reports 2012 Presidential Election Graph
Chart linked from article source: http://www.centerforpolitics.org
Prof James Campbell of the University at Buffalo -13 models’ forecasts
Source: James E. Campbell, “Forecasting the 2012 American National Elections: Editor’s Introduction,” PS: Political Science & Politics, v.45, n.4 (October 2012), forthcoming.
UPI Presidential Election Poll
UPI Upate: Fr.2Nov12: likely voters R=48% • O=48%
Pew: Obama-50% & Romney-47% (Su.4Nov12)
Pew Research Presidential Election Poll Sunday 4Nov12
8 October 2012 Mitt Romney no longer trails Barack Obama in Pew Research Center polling. Voters say Romney did a better job than Obama in the Oct. 3 debate. Romney is now better regarded on most personal dimensions and most issues than he was in September.

This chart tracks likely voters, based on national polls conducted by Pew Research Center. (Su.4Nov12)

chart source: http://wiki.abulsme.com/2012_Electoral_College_Prediction
2012 August to November Electoral College Trend Chart

source: http://www.timeanddate.com/clocks/freecountdown.html
source: http://mycountdown.org/Event/Elections/

The Election:
"Elections Are Not Won by Who Voted, They are Lost by Who Did Not" ~ rfh
"Arm your self with the ballot, while you still have arms." -- rfh
Use the Voter Lookup tool below to find friends, family, and collegues who may not be registered to vote.   For those not registered, you can download a voter registration form and give it to them or email it to them in order to get them registered.  Are You Registered?  Check to confirm that you and your friends are registered to vote. CLICK HERE:  http://www.wallbuilders.com/vote/ or http://areyouregistered.org

Your Vote Is Important!:
"There have been 12 Presidential elections that were decided by less than a 1% margin; meaning if less than 1% of the voters in certain states had changed their mind to the other candidate the outcome of the entire election would have been different, e.g. year 2000: Margin: < 1%, only a few hundred votes in one state and e.g. year 1960: Margin: < 1%.
(sources: http://www.mit.edu/~mi22295/elections.html & http://www.infoplease.com/spot/closerace1.html)

Are you & friends registered to vote?

• ProLife Voting Guide: http://nrlc.capwiz.com/election/home/
• Judeao-Christian Voting Guides: http://www.judeo-christianvoterguide.com & http://www.christianvoterguide.com/
• 2nd Amendment States Voting Guide: http://www.nrapvf.org
• 2nd Amendment California Voting Guide: http://www.gunownersca.com/component/k2/item/2397-2012-candidate-ratings
• 2nd Amendment: Download your CRPA 2nd Amendment Election Guide & Voting Recommendations for 2012:
   http://blog.crpa.org/wp-content/uploads/2012/05/May-2012-CRPA-Election-Guide-Voting-Recommendations-UPDATE-5-14.pdf
• 2nd Amendment: NRA U.S. House and Senate election recommendations, grades and endorsements here:
   http://www.nrapvf.org/grades-endorsements/2012/california.aspx


Four things you can do to help the world and to Save America: http://www.glennbeck.com/fourthings/
From: OnTheIssues.org
Abortion
Budget & Economy
Civil Rights
Corporations
Crime
Drugs
Education
Energy & Oil
Environment
Families & Children
Foreign Policy
Free Trade
Government Reform
Gun Control
Health Care
Homeland Security
Immigration
Infrastructure & Technology
Jobs
Principles & Values
Social Security
Tax Reform
War & Peace
Welfare & Poverty

Find, Contact Officials, Make Your Opinions (rfh)
• Freedom Connector: http://connect.freedomworks.org (local organizations)
email Congress & W.H.: http://capwiz.com/congressorgfb/issues/
• Linked from Harrold's Blog:
  - full: http://harrolds.blogspot.com
  - posts only: http://www.google.com/reader/view/feed/http://harrolds.blogspot.com/feeds/posts/default?hl=en
  - mobile mode: http://harrolds.blogspot.com/?m=1
  - list videos only: http://www.youtube.com/blogs/id/AJXOW5DnyFc
  - text only: http://www.google.com/search?strip=1&q=cache:harrolds.blogspot.com
Forgotten Past+Founding Documents eBooks+Federalist Papers+American Minute History+Essential: B.C. to Now Founders'+Quotes+American Values
 Magna Carta:TimeLine Arbroath Declaration small speaker icon Scots Wha Hae small speaker icon History of: The US Bill of Rights Constitution+Amendments